


For every 100 creative venues that have survived since 2015, 69 have shut their doors.
That’s according to a TicketSource analysis of Companies House data. We looked at companies registered under the “entertainment venue” category – which includes arts venues, music spaces, local creative hubs, and community-led cultural spaces. For simplicity, we’ll refer to these as venues throughout.
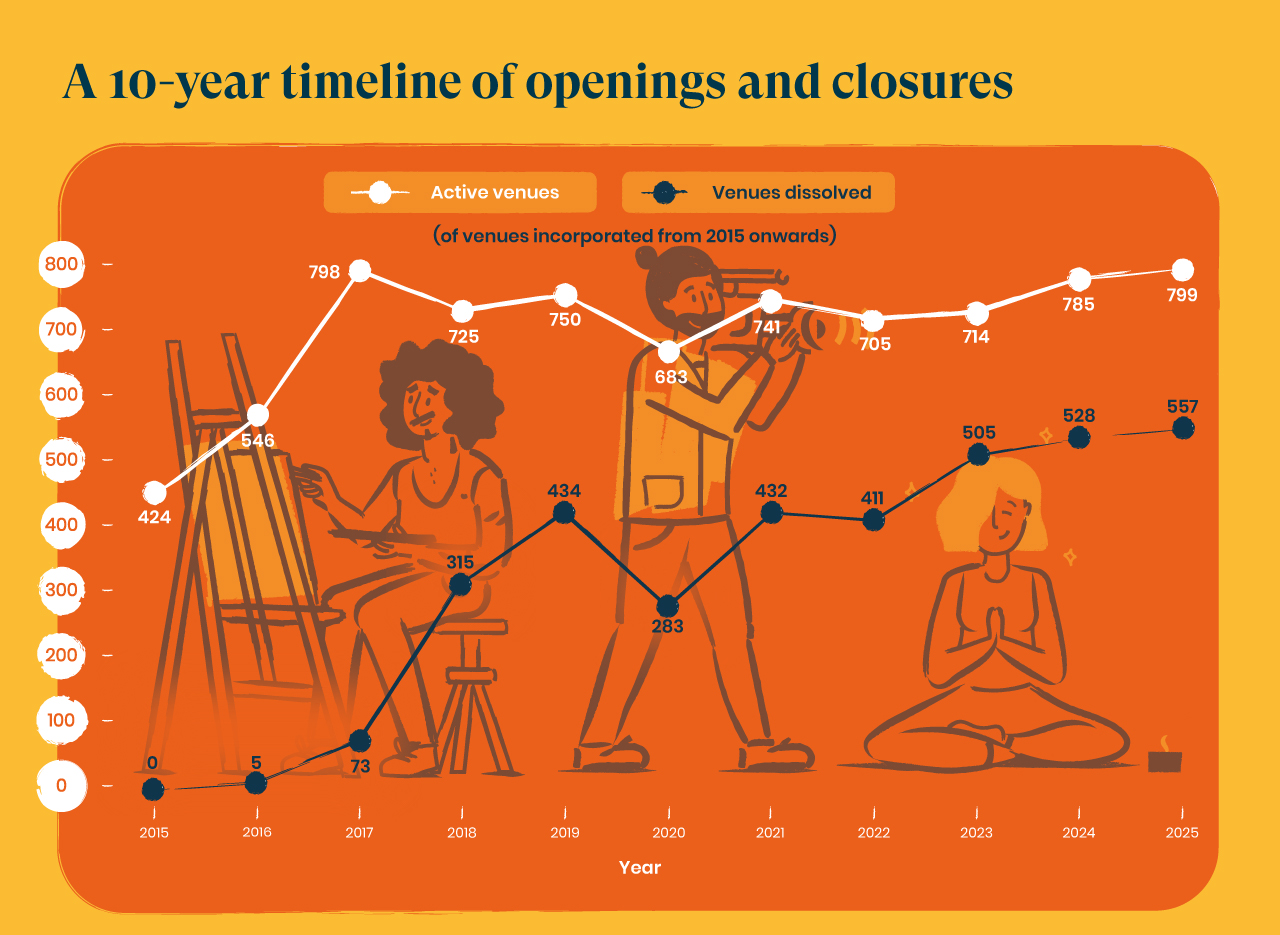
On paper, the sector has grown sharply, with the number of venues incorporated rising from 424 in 2015 to 799 in 2025. But the churn underneath that growth is hard to ignore.
As of February 2026:
So while new venues are still opening their doors, plenty are still closing.
Not yet, but the gap is tighter than many might expect.
Back in 2015, there were 424 companies founded. By 2025, that number was 799 founded – a rise of 88%.
This comparative increase suggests creative demand has not disappeared. New organisers are still launching venues. New ideas are still finding space. But growth alone does not tell the full story.
| Metric | Value |
|---|---|
| Venues founded in 2015 | 424 |
| Venues founded in 2025 | 799 |
| Closure-to-opening ratio in 2025 | 69% |
| Average openings per day in 2025 | 2.2 |
| Average closures per day in 2025 | 1.5 |
| Average openings per week in 2025 | 15 |
| Average closures per week in 2025 | 11 |
In 2025, 799 new companies were registered, while 557 were dissolved. That means openings are still ahead, with closures running at just under 70% of the same pace.
Broken down over the year, that works out as:
Or, put another way:
That is a positive net gain, but a narrow one.
That does not point to extinction, but it does show how little room there is between growth and decline. A single difficult year of rising costs, weaker audiences, or reduced local funding could quickly shift that balance.
| Year | Entertainment venue companies incorporated per year | Entertainment venue companies dissolved* | Net change | Running total of incorporations |
|---|---|---|---|---|
| 2015 | 424 | 0 | 424 | 424 |
| 2016 | 546 | 5 | 541 | 965 |
| 2017 | 798 | 73 | 725 | 1,690 |
| 2018 | 725 | 315 | 410 | 2,100 |
| 2019 | 750 | 434 | 316 | 2,416 |
| 2020 | 683 | 283 | 400 | 2,816 |
| 2021 | 741 | 432 | 309 | 3,125 |
| 2022 | 705 | 411 | 294 | 3,419 |
| 2023 | 714 | 505 | 209 | 3,628 |
| 2024 | 785 | 528 | 257 | 3,885 |
| 2025 | 799 | 557 | 242 | 4,127 |
*Of companies incorporated from 2015 onwards. Companies House dissolution records are not consistently available before 2010. This means dissolution activity in earlier years in this table may be underreported.
For much of the 2010s, the sector expanded rapidly, with a wide gap between new openings and closures.
Openings climbed quickly through the second half of the decade, rising from 424 in 2015 to 798 in 2017, the second-highest annual figure in the full timeline. During this period, closures remained relatively low, with just five dissolutions recorded in 2016 and 73 in 2017.
Growth during these years was not just consistent, but accelerating, as new formats and experiences began to attract wider audiences. Immersive theatre, while present earlier, became more established during this period, while pop-up concepts that had gained momentum after the 2008 financial crisis continued to influence how new ventures were launched.
But then the pressure becomes harder to ignore.
Closures began to rise more sharply after 2017, increasing from 73 that year to 315 in 2018. By 2019, 434 companies were dissolved in a single year, significantly narrowing the gap between openings and closures.
Terry Rosoman, Head of Marketing at TicketSource, comments on what could be lost if venue closures continue:
“The UK is not at an extinction point just yet, but the margin is narrow enough to make the question feel uncomfortably real.
In 2025, the sector added 242 venues overall, with 799 openings offset by 557 closures. On the surface, that still looks like growth, but the gap is clearly tightening.
If that trend continues at a similar pace, closures could begin to match openings within the next decade.
That wouldn’t mean venues suddenly disappear. But it would mark quite the shift – the point where the sector stops growing and starts to stand still.”
| Venue companies dissolved within... | Percentage |
|---|---|
| 1 year | 4% |
| 3 years | 73% |
| 5 years | 89% |
Among dissolved companies in the dataset, 4% closed within their first year, 73% within three years, and 89% within five years.
That means almost three-quarters of venues that closed did so before reaching their third anniversary, while nearly nine in 10 had closed within five years.
The median lifespan across dissolved venues was 2.1 years, meaning the typical closure falls well within a venue’s early-stage lifecycle.
Taken together, the figures suggest that if a venue is going to close, it is likely to happen in its earliest years.
Terry Rosoman on why so many venues fail in the first five years:
“Early closure is rarely down to one single issue. More often, it’s the point where several pressures collide at once.
Location can make a huge difference. A venue in the right area might benefit from steady footfall, strong local partnerships, and returning audiences. Others face a much tougher climb – especially if they’re competing for attention in crowded areas or trying to reach audiences who simply don’t know they’re there yet.
Business model plays a part too. Venues that rely on a narrow programme or a single type of audience can be more vulnerable when habits shift, costs rise, or bookings slow. Those with a more flexible offering (mixed programming, private hire, or food and drink) often have more ways to adapt and keep going.
The data also shows that many closures happen early. And in reality, that’s often the hardest part – turning a great venue idea into something that can truly last.”
The pandemic years added a new layer of uncertainty, but the sector did not reverse entirely. In 2020, 683 companies were registered, while 283 were dissolved, leaving a net gain of 400.
That suggests many organisers were still willing to start new ventures, even during one of the most uncertain periods live events had faced in decades.
| Incorporation year | Survival rate |
|---|---|
| 2015 | 43% |
| 2016 | 39% |
| 2017 | 35% |
| 2018 | 35% |
| 2019 | 47% |
| 2020 | 39% |
| 2021 | 46% |
| 2022 | 46% |
| 2023 | 53% |
| 2024 | 75% |
| 2025 | 98% |
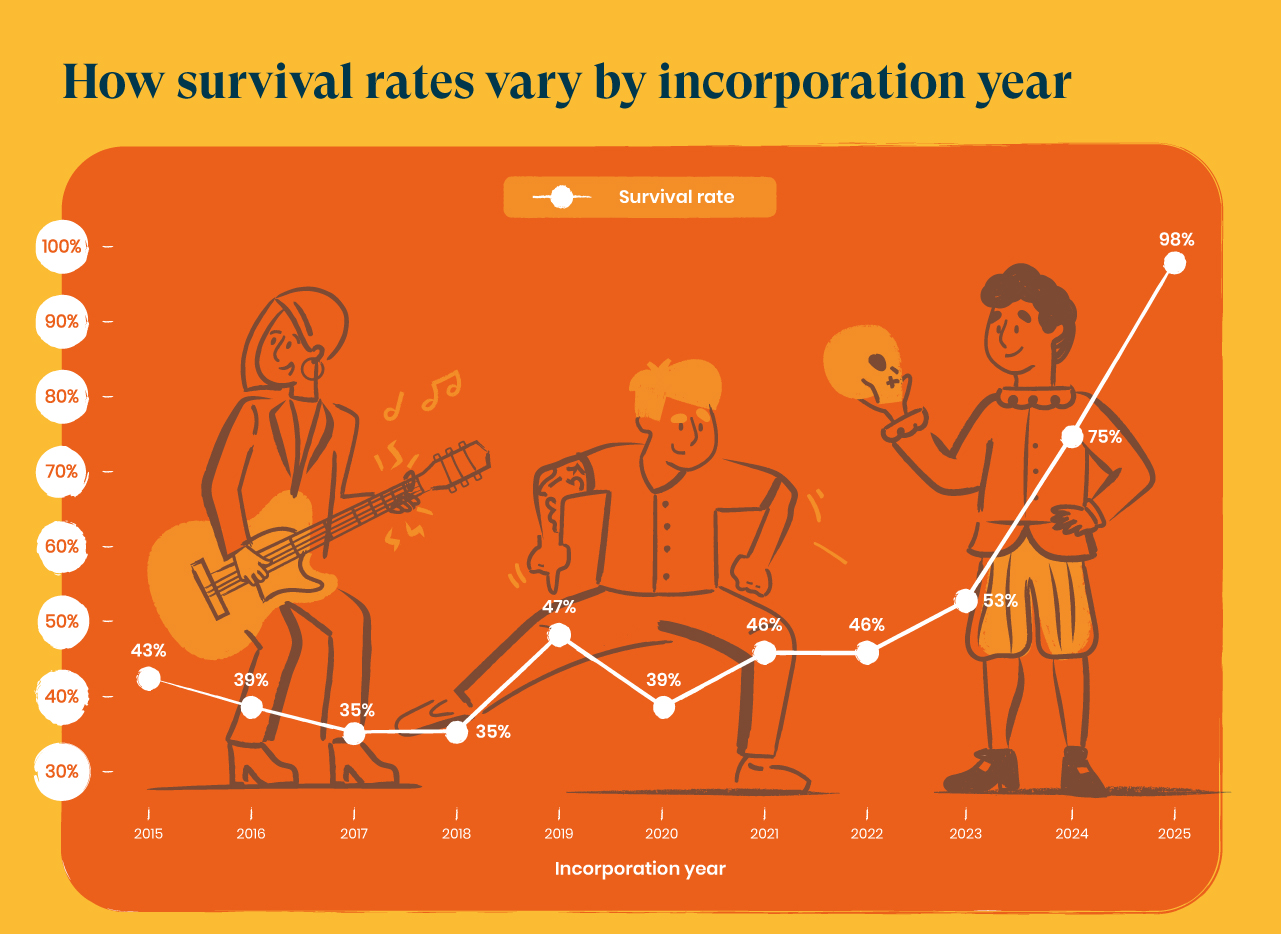
Survival rates are notably lower among venues launched in the mid-2010s. Of those incorporated in 2015, 43% are still active today, falling to 39% in 2016 and to just 35% in both 2017 and 2018.
More recent years show signs of improvement. Survival rates rose to 47% for 2019, while venues launched in 2021 and 2022 both stand at 46%.
At first glance, newer venues appear to be holding up better:
Part of that is likely down to time. Newer venues have not yet faced the same length or variety of trading conditions as businesses founded years earlier.
However, it may also reflect how venues are opening today. In the years following COVID-19, operators have had to adapt to shifting audience behaviour, rising costs, and greater uncertainty. As a result, newer ventures may be entering the market with more flexible formats, stronger digital promotion, and income streams that extend beyond ticket sales alone.
| Rank | Local authority | Venue incorporated* | Venue dissolved* | Net change* | Net change (per 100,000 people)* |
|---|---|---|---|---|---|
| 1 | Camden | 492 | 266 | 226 | 104 |
| 2 | Westminster | 322 | 144 | 178 | 85 |
| 3 | Islington | 353 | 204 | 149 | 67 |
| 4 | Hackney | 280 | 150 | 130 | 49 |
| 5 | Kensington and Chelsea | 78 | 34 | 44 | 30 |
| 6 | Tower Hamlets | 137 | 64 | 73 | 22 |
| 7 | Thanet | 47 | 17 | 30 | 21 |
| 8 | Haringey | 88 | 43 | 45 | 17 |
| 8 | Lambeth | 91 | 37 | 54 | 17 |
| 8 | Southwark | 98 | 46 | 52 | 17 |
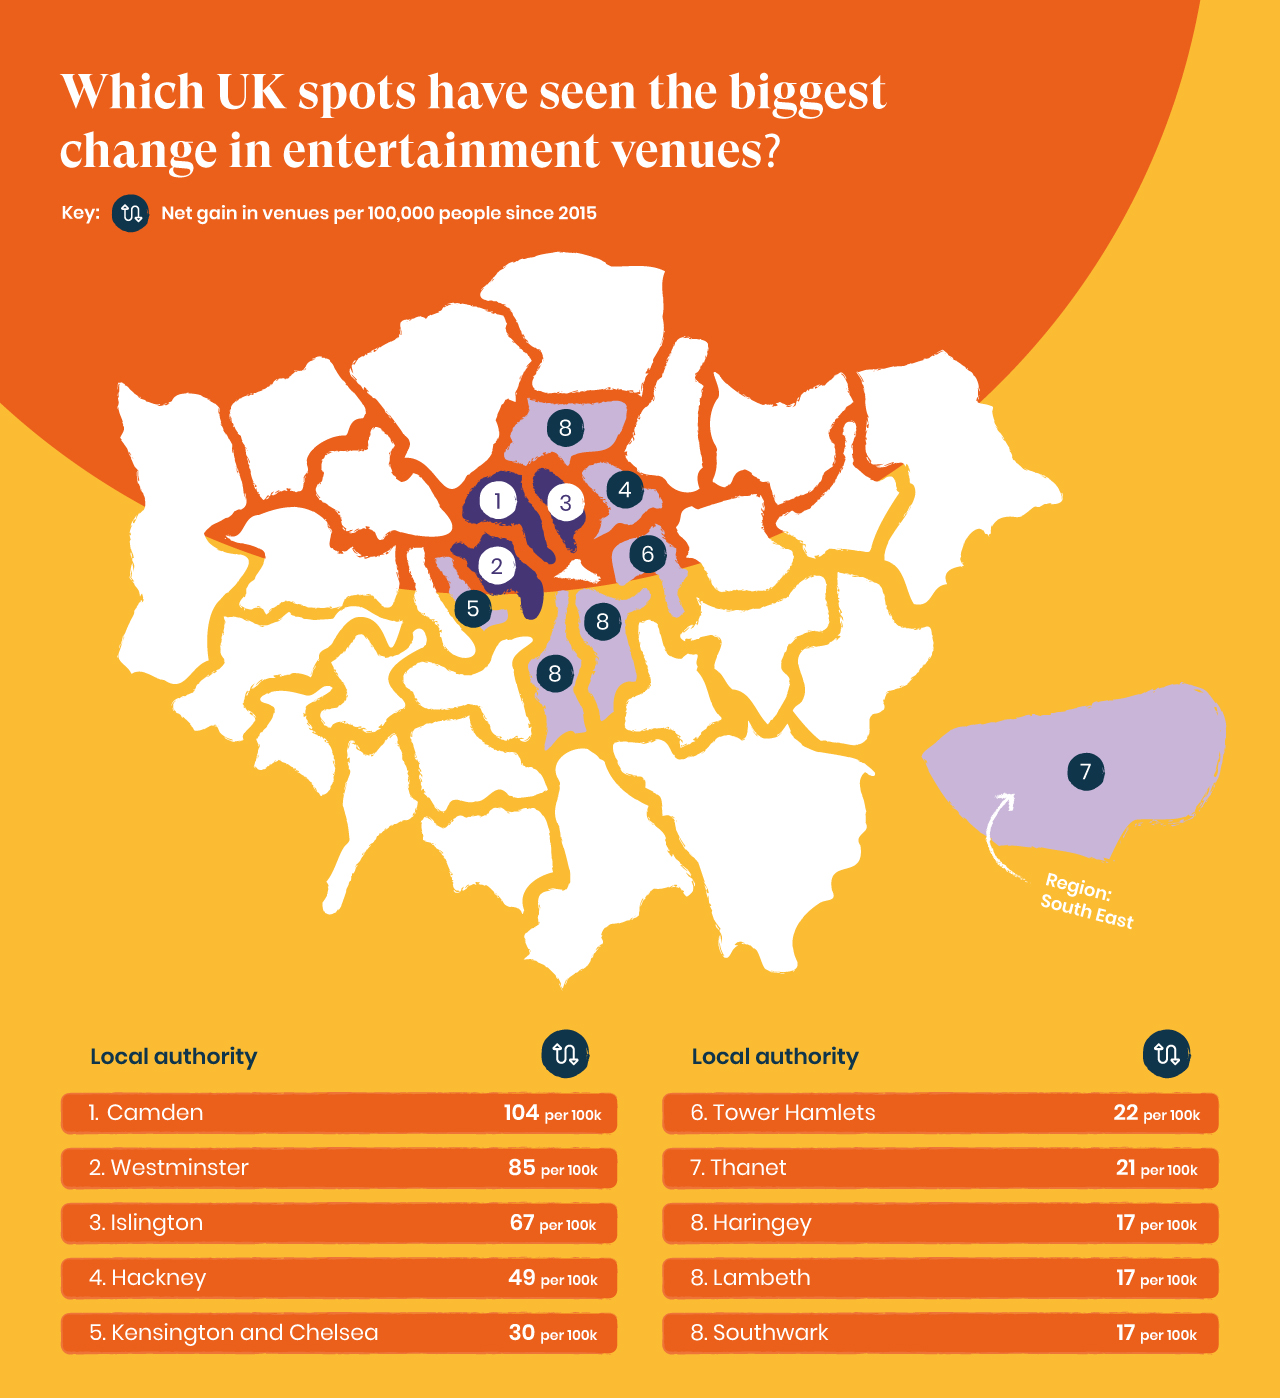
London features heavily at the top of the table, with Camden, Westminster, Islington, and Hackney all recording the largest net gains in venues since 2015. Camden alone saw 492 new companies, with a net increase of 226, the highest anywhere in the UK.
That pattern shows how areas with dense footfall, established nightlife, and strong cultural identities can give venues more opportunities to build regular audiences.
But the picture does not stop in the capital.
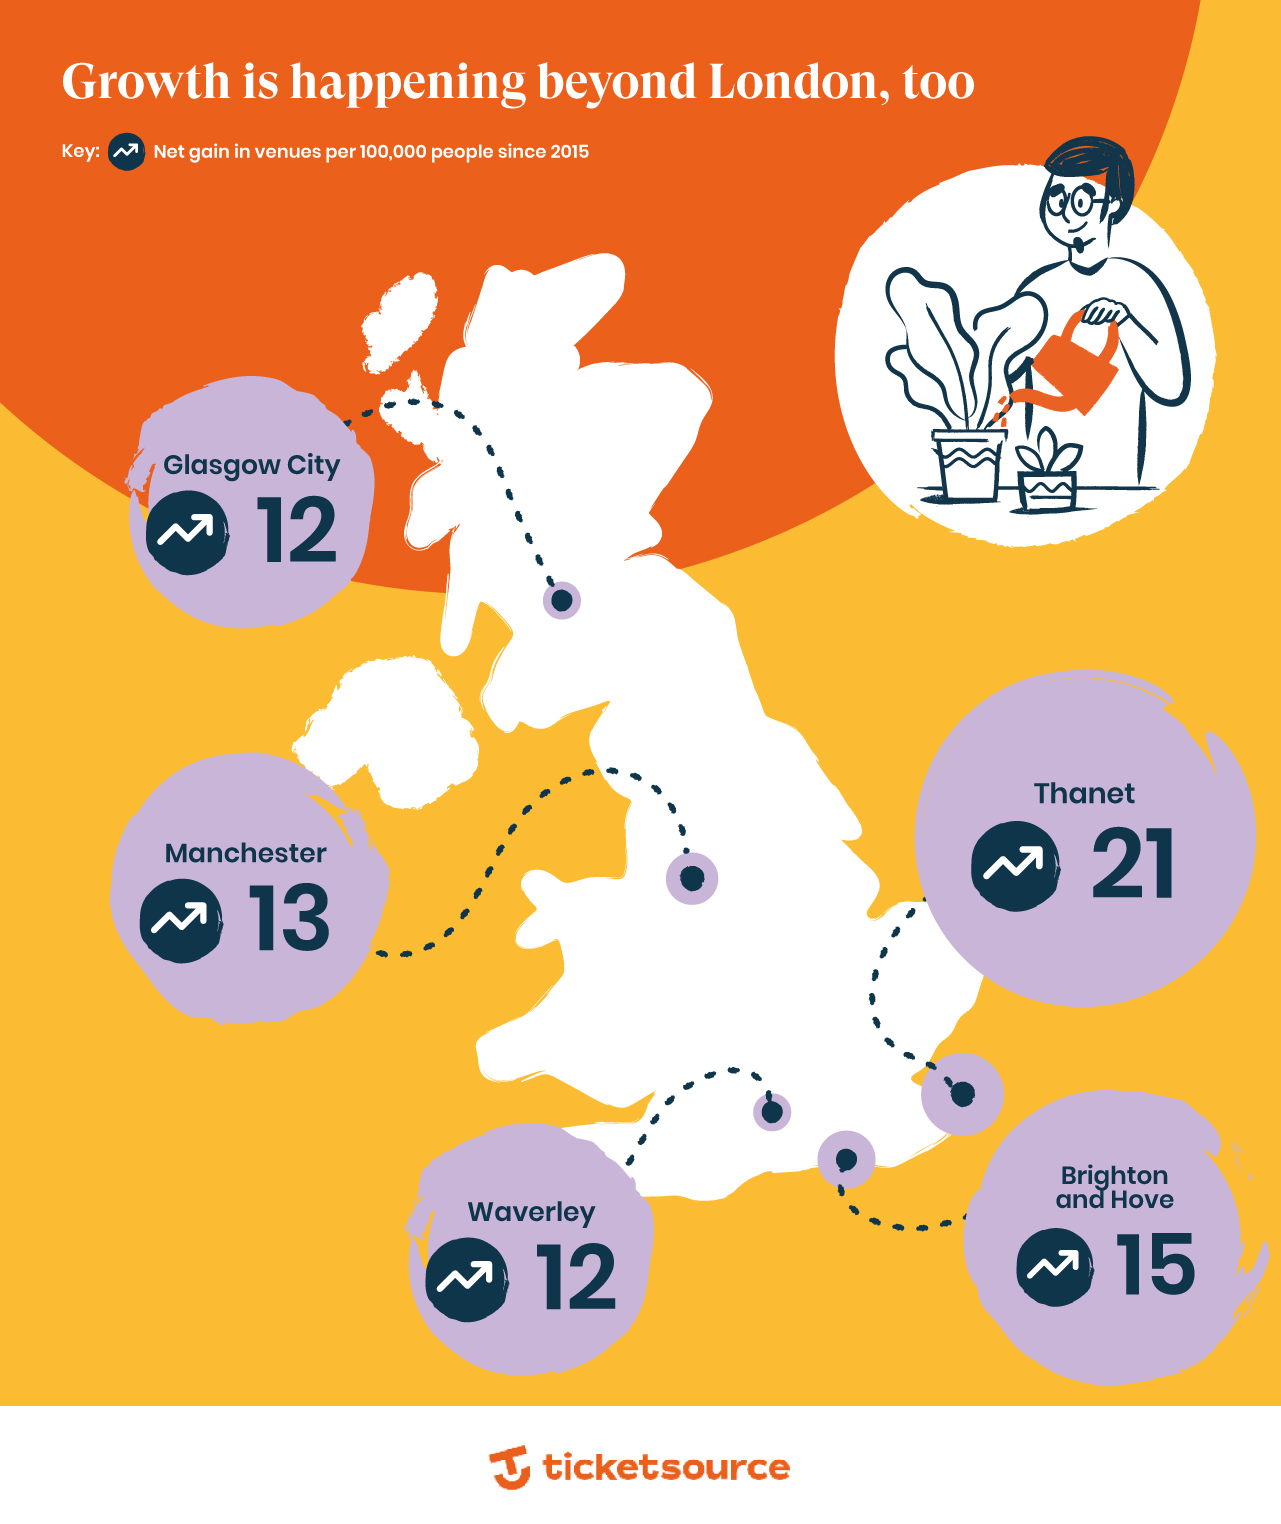
| Rank | Local authority | Venue incorporated* | Venue dissolved* | Net change* | Net change (per 100,000 people)* |
|---|---|---|---|---|---|
| 1 | Thanet | 47 | 17 | 30 | 21 |
| 2 | Brighton and Hove | 68 | 26 | 42 | 15 |
| 3 | Manchester | 122 | 47 | 75 | 13 |
| 4 | Glasgow City | 142 | 64 | 78 | 12 |
| 4 | Waverley | 21 | 5 | 16 | 12 |
| 6 | Cardiff | 143 | 102 | 41 | 11 |
| 6 | City of Edinburgh | 93 | 37 | 56 | 11 |
| 6 | City of Bristol | 83 | 31 | 52 | 11 |
| 9 | Norwich | 32 | 17 | 15 | 10 |
| 9 | Herefordshire (County of) | 34 | 15 | 19 | 10 |
Several areas are also showing steady gains, even if at a different scale:
That matters at a time when major cultural moments are increasingly being shared beyond the capital, including events like the Brit Awards moving to Manchester for 2026.
But beyond large-scale events, the data also points to something more local. Areas like Thanet and Norwich, which rank highly when adjusted for population, suggest that growth is not driven solely by major cities but by smaller, community-led venues opening at a steady rate.
In these areas, new venues are more likely to serve local audiences first, whether through independent theatre, pop-up performances, or multi-use creative spaces. That can make them more responsive to local demand, but also more exposed to the early-stage pressures highlighted elsewhere in the data.
Even with closures running close to openings, new talent is still finding ways to break through. In most cases, that starts in smaller spaces, with venues willing to take chances on new names, local promoters, and first-time events.
Those early opportunities matter for emerging artists. Smaller venues often offer the first real chance to test material, build confidence, and learn what connects with a live audience. They are also where local followings begin, long before bigger bookings come into view.
That is why entertainment venues continue to play such an important role. They do not just host events; they help shape what comes next.
What matters most is staying useful to the people nearby, while giving them reasons to keep coming back. That often means:
The venues most likely to last are not always the biggest. Often, they are the ones that adapt quickly, stay close to their audience, and keep giving people a reason to come back.
TicketSource is a leading ticketing platform built for live events of all sizes, working with venues, promoters, and organisers to help bring performances, festivals, and community events to life.
Because smaller venues often serve as the first stage for emerging talent and local audiences, we wanted to understand how the UK’s creative venue landscape has changed over time, where growth is still occurring, and how close closures are to new openings.
To do this, we sourced data from Companies House. We used the nature of business (SIC) filter to identify businesses with SIC code 90040 - Operation of arts facilities. Only businesses incorporated from 01/01/2015 onward were included.
Please note:
Annual openings and closures
For each calendar year (2015–2025), we counted the number of companies incorporated and dissolved. Companies House dissolution records are not consistently available before 2010. This means dissolution activity in earlier years may be underreported and should not be directly compared with more recent trends.
Net change
For each year, the net change was calculated by subtracting the number of companies dissolved from the number incorporated.
Active venue companies over time
A running total was calculated to estimate the number of companies active after each year from 2015 onward. This was calculated by adding each year's net change to the cumulative total from the prior year. Note: this only includes active companies incorporated since 01/01/2015 and does not include companies incorporated before 2015.
Active today
We calculated the percentage of all businesses in the dataset that are still active, dissolved, or in insolvency/financial distress (as of 27/02/2026).
Lifespan and survival
Lifespan was calculated for dissolved companies only (because active companies do not yet have an end date), based on their incorporation and dissolution dates. The percentages of companies dissolved within 1, 3, and 5 years were also calculated. Note: these figures include only dissolved companies, not the probability that any newly formed company will close within those timeframes (because active companies are excluded from this calculation).
Local authority analysis
Registered office addresses were used to derive postcodes for each business. Postcodes were then mapped to local authorities using the ONS postcode directory. Any companies where a local authority couldn't be determined were excluded from this section but included in national-level metrics. For each local authority, the following were calculated across the full 2015–2025 period:
Results were normalised per 100,000 residents, using ONS population data. Any local authorities with fewer than 100,000 people were removed from the analysis. All data was collected in April 2026 and is correct as of then.
Sources:
The BRITs moves to Manchester! - BRITsGet free professional advice and information regarding event organising sent straight to your inbox.

You may opt-out of future TicketSource emails at any time using
the unsubscribe link within the email.
Read our Privacy Policy here.
An easy to use, free online event ticketing system for any type of venue or event. Promote, manage and sell your event tickets online ‐ all for free!

TicketSource is a free and easy to use online event ticketing platform for any type of venue or event. Promote, manage and sell your event tickets online - all for FREE.